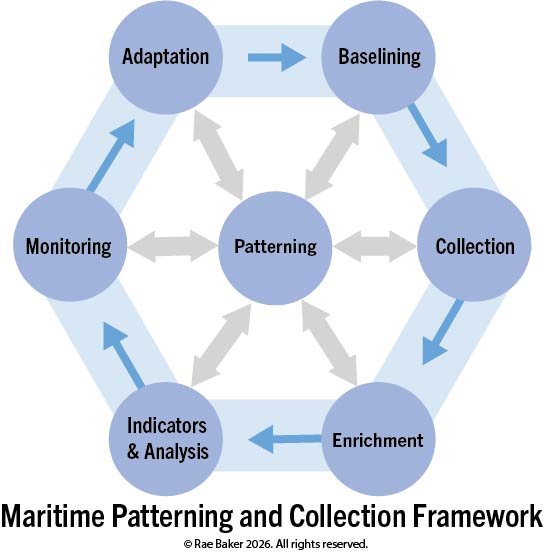
Maritime Patterning and Collection Framework

Hello friends, it has been a while. I want to introduce something I have been developing for maritime analysts: The Maritime Patterning and Collection Framework. It is meant to be a way to organize the chaos that is maritime data and create a workflow that actually supports day-to-day work in this domain.
Why Did I Make This Framework?
If you have ever worked in the maritime space, you know the problem is not a lack of data (AIS, vessel registries, satellite imagery, corporate records, port logs, social media) it is a lack of structure. Feeds pour in from every direction, and analysts are somehow supposed to “keep an eye” on everything happening across an endless ocean, which usually means reacting to alerts instead of understanding behavior.
The Maritime Patterning and Collection Framework (MPCF) is my attempt at trying to force analysts to rely less on a blip in time and instead anchor everything in patterns: what is normal, what is repeatable behavior, and what can be exploited. The concept has seven phases: Baselining, Collection, Indicators & Analysis, Enrichment, Monitoring, Adaptation and Patterning, which map directly to the work that an OSINT-heavy analyst in this area already does. Let’s dive in (see what I did there?)
Patterning: The Center of Maritime Analysis
Patterning sits at the center of this framework for the same reason feedback sits at the center of the Intelligence Cycle, because it informs all the other steps. Thinking in patterns helps uncover the anomalies that specifically drive maritime analysis work. An Iranian oil tanker that meets up with a Chinese ship for 5 hours each time it exits the Singapore Strait, a “research” vessel that sticks close to undersea cable routes, and a fishing vessel that routinely ‘goes dark’ before it enters a protected fishing zone are all patterns worth noting but yet not fully realized without the other steps in this framework. It is about building these anomalies out in a structured way.
Baselining: Understand the Normal Before Seeking the Anomaly
This is where you look at a focus of your choosing (chokepoint, fleet, country flag, EEZ, ocean, etc.) and ask the boring questions about it. Who is here every day? What are the normal shipping lanes? What are the peak times/seasons of activity? What flags dominate the area? What type of vessels dominate the area? Which areas are used less frequently? What historical/political implications are at play?
This is not necessarily the most exciting part of the process, but it is necessary. Outlining this part gives you something to test against when you kick off a new investigation and makes it easier for new analysts to pick up the task if there is a steady baseline in place.
Collection: Time to Task
Now that a baseline has been prepared, the gaps should be more obvious. Baselining may have unearthed some noticeable patterns, and now we have to ask, “What do I need to see to sharpen it”? Maybe that is satellite imagery, maybe it’s social media posts showing photos of ships at port, or maybe it’s corporate records. In a broader intelligence setting, you might be able to task satellites or aircraft; in pure OSINT, you harvest what is publicly available. Either way, each collection decision should be tied to a specific patterning question so that when priorities shift, you can explain why a sensor, dataset, or subscription is worth the cost. The framework pushes you to link each collection decision to a specific patterning problem so that later, if priorities shift, you can justify the cost of a sensor tasking or a commercial subscription.
Enrichment: A Woven Tapestry of Data
Enrichment is where you weave all the collected data together (imagery, public records, sanctions lists, AIS tracks) and focus on the gaps. Ask what you would need to see to be more confident that the findings are benign or, on the flip side, genuinely actionable, then go hunting for it. If AIS suggests that a vessel may be skirting sanctions by transferring cargo to an inconspicuous vessel, can you see that transfer in imagery? Does RF line up? Can you find port photos or local reporting that confirm or challenge the hypothesis? The goal is to test your assumptions from every angle.
Indicators & Analysis: Turning Gut Feelings into Insight
Most analysts know the feeling that “something is off,” but gut instinct does not scale to a team or your leadership very well. Indicators are how you turn those feelings into observable behaviours like “consistent dark activity near US infrastructure” or “research vessels deploying ahead of a missile launch.” The patterns uncovered in each phase of this framework should feed into a living list of indicators you can actually watch for.
Analysis begins once those indicators are observed. This is where you combine the baseline, the triggered indicators, and the enriched context to answer the questions decision makers actually care about:
What is happening?
Who is involved?
How unusual is this activity?
What could happen next?
Good analysis isn’t going to just repeat the data or the patterns but explain why it matters, where the uncertainty is, and what to look out for as the situation evolves.
Monitoring: Keep the Lighthouse Lit
Monitoring is the day‑to‑day grind, keeping an eye on the indicators and patterns that emerged from the earlier phases. Keep a living list of active indicators and documentation, and watch for emerging behaviors that might justify restarting the framework. This is also where process discipline pays off. If each case clearly notes which indicators were observed, which collections are feeding it, and how it ties back to the baseline, you avoid losing context across analysts/tasks, and you can reconstruct what was known if something later goes wrong.
Adaptation: Changing Tides
Maritime threats evolve rapidly. Actors learn which behaviors trigger detection and are actively working around them with spoofing, false‑flagging, and physical manipulation. Build adaptation into the process, like regularly reviewing indicators, baselines, and recent cases against geopolitical shifts and new tradecraft. Treat those reviews as part of the workflow, not an optional add-on on so you can keep up with the evolving environment.
Getting Started
If you want to try this within your own team, don’t try to boil the entire ocean. Pick one concrete problem, like potential suspicious activity around specific infrastructure or a small fleet of high‑risk vessels, and run it through the loop. Build a baseline, define a group of indicators, decide how you will handle analysis, choose two or three realistic enrichment sources, and set up a monitoring routine. After a few passes through, you will have something you can refine and scale.
The Maritime Patterning and Collection Framework is not meant to replace the intelligence cycle or your existing processes. It is a bridge between these high‑level concepts and the messy reality of maritime work. If it helps analysts spend less time drowning in data and more time understanding the unique and fascinating behaviors at sea, then it is doing its job.